

controls
Check how to use EyeCharts controls
Remote Control, Keyboard, Mini-Keyboard
EyeCharts is compatible with any kind of keyboard controllers (standard keyboards, wifi keyboards, mini-keyboards).
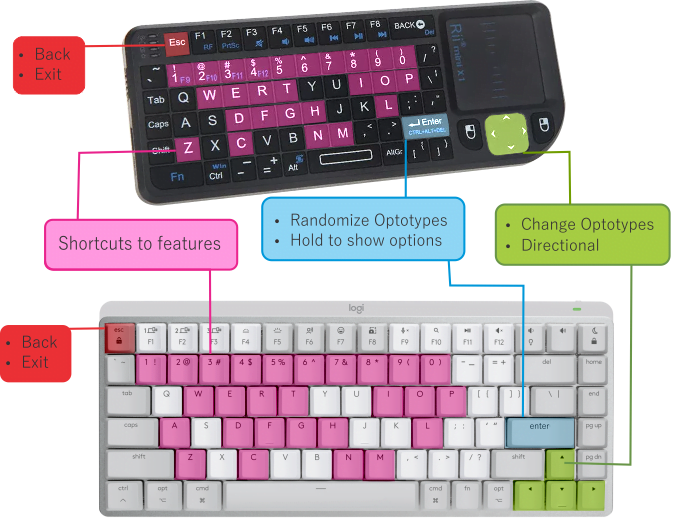
Letter Shortcuts:
Number Shortcuts:
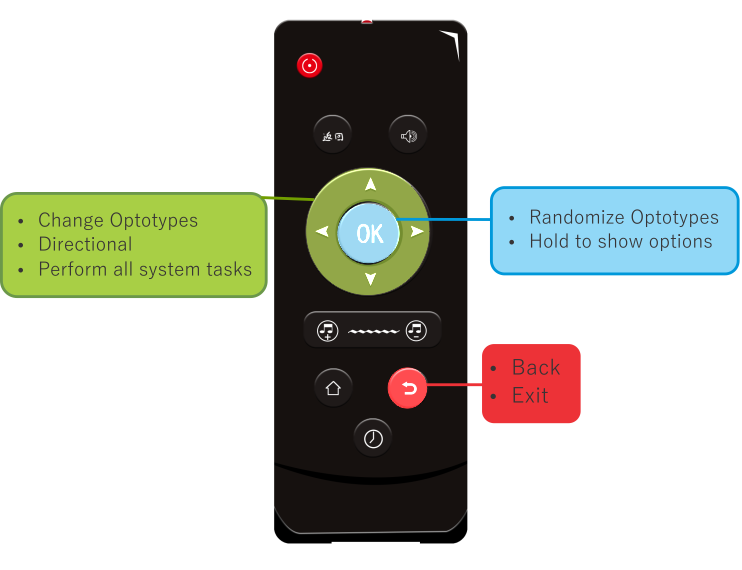
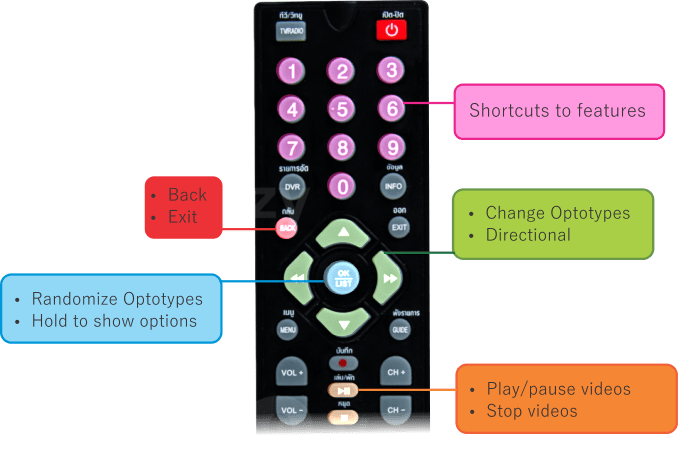
EyeCharts works with any kind of remote controls of compatible devices:
TV Remote control (slim):
TV Remote control (standard):
Configuring
The eyecharts set up.
How to configure to your needs?
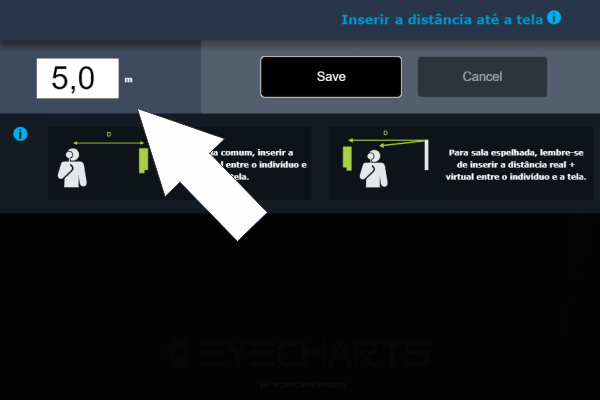
Measure the distance between the patient’s eyes and the screen.
Measure the distance between the patient’s eyes and the screen. Note: if you use a mirrored room you should enter the full distance (screen to mirror plus mirror to eyes)
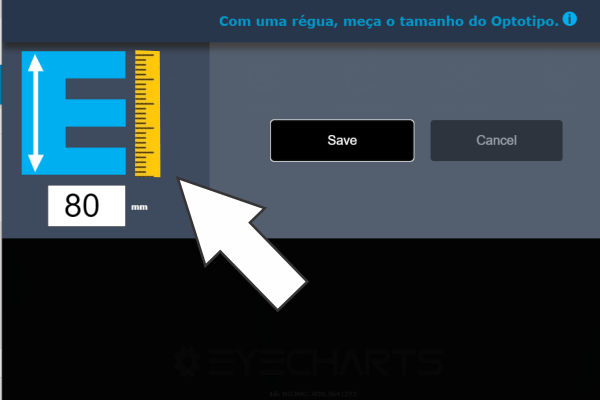
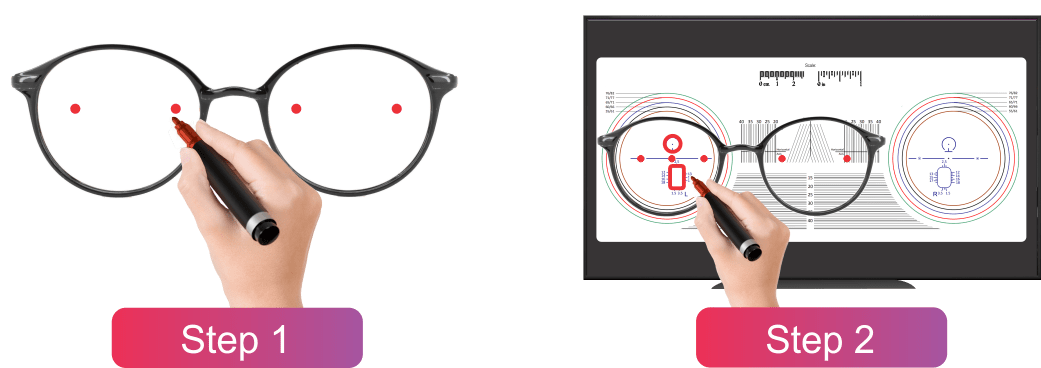
To configure the screen resolution, use a ruller to measure the blue optotype that shows in the screen.
Here you can select the starting chart. You can also select the starting visual acuity.

Choose your preferred visual acuity notation: imperial, meters, decimal or x/10 fraction.
They will be set to preferred visual acuity units every time you run EyeCharts.
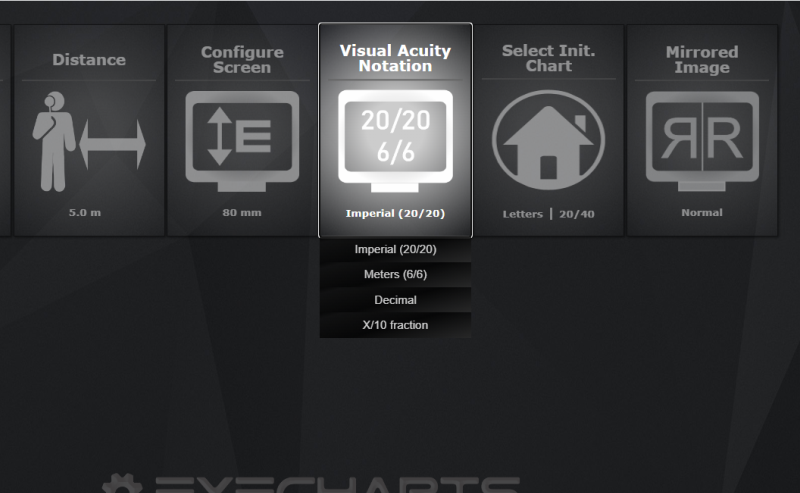
You can change the settings to mirrored offices. You can chose to mirror all the pages or only the optotypes.
Note: if you use a mirrored room you should enter the full distance (screen to mirror plus mirror to eyes) in distance settings.


To switch between multiple monitors just use the hotkeys that move your active window from one screen to another. The default hotkeys for are Win+Shift+Left arrow and Win+Shift+Right arrow, which move your window to the left or right monitor, respectively.
Note: This function is only applicable to Windows systems.

Operating
In this section you will learn…
How to operate the EyeCharts Visual Acuity System
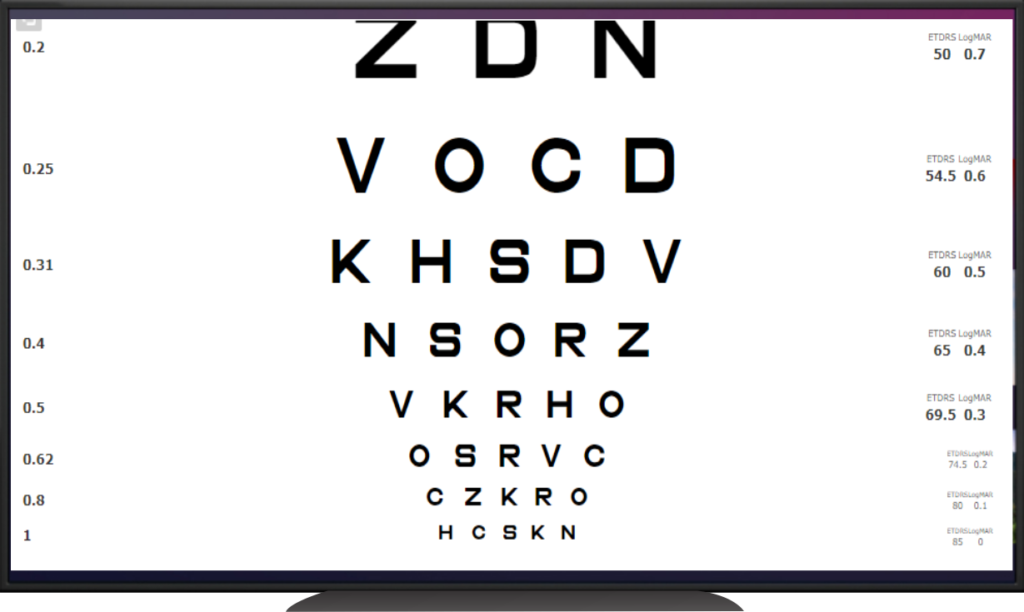
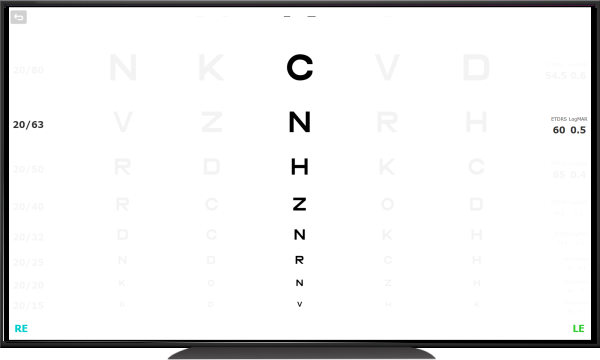
Use arrows to control the optotypes sizes.
Use the OK/Enter button to change the optotypes.
Use arrows to Focus the optotypes.
Use the OK/Enter button to change the optotypes.
You can also convert to columns usign rigtht and left arrows.
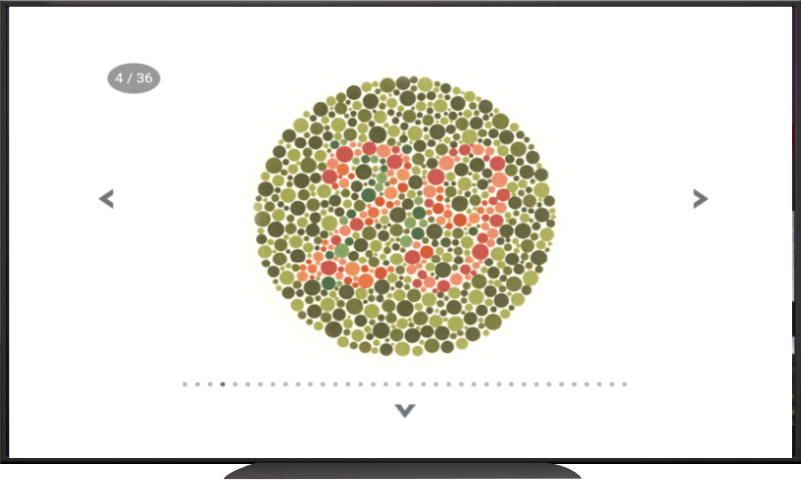
Use arrows LEFT and RIGHT to control the plate of Ishihara test.
Us arrows UP and Down to Show or Hide the result of Ishihara test.
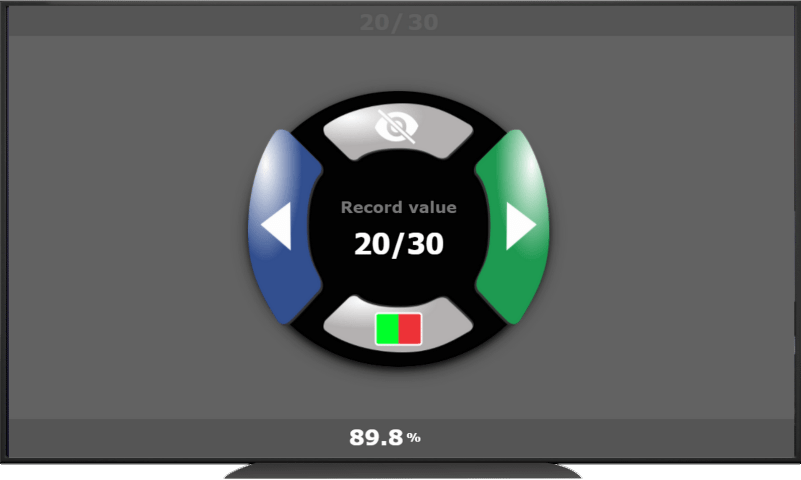
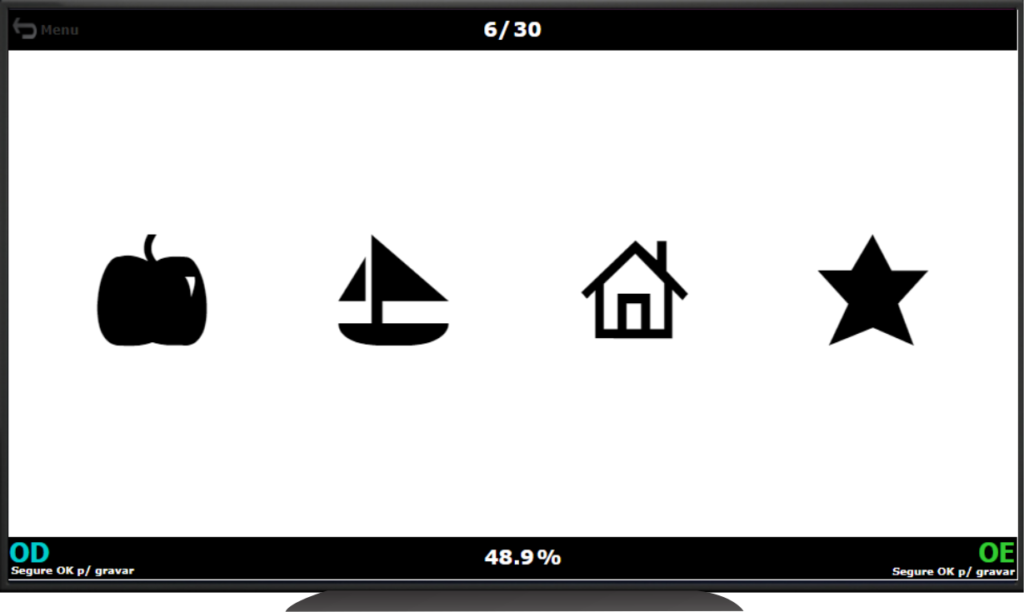
To record the Visual Acuty just HOLD OK/Enter button to show the options.
Then click left arrow to record to Left Eye or Right arrow to record to Right Eye.
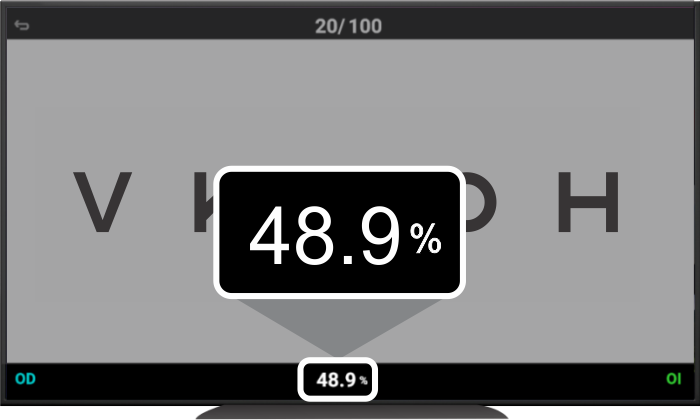
The Snell–Sterling Efficiency Scale is a method used to quantify visual efficiency as a percentage, based on a person’s visual acuity. It provides a more detailed and continuous scale compared to simpler models, such as decimal notation and those used in the American Medical Association (AMA) guides. This scale calculates the functional vision remaining for an individual, factoring in both central visual acuity and sometimes peripheral vision.
The Snell–Sterling efficiency scale sets 20/20 (MAR = 1′) as 100% efficiency, and reduces the efficiency by a fixed percentage (≈ 83%) for every 1 minute loss of acuity.
To illustrate, it is not accurate to assume that an individual with 20/40 (6/12 or 0.5) vision has only 50% of vision, as this does not accurately reflect the functional visual loss. Instead, visual efficiency provides a more precise representation of the remaining visual capacity. According to the Snell–Sterling scale (see table below), individuals with a visual acuity (VA) of 0.5 do not have merely 50% of vision, but rather 83% Visual Efficiency. This demonstrates the importance of using visual efficiency metrics rather than raw percentages to evaluate functional vision.


On the optotypes page, just HOLD the OK/Enter button to show options.
Then set the Red-Green Test options to ON.
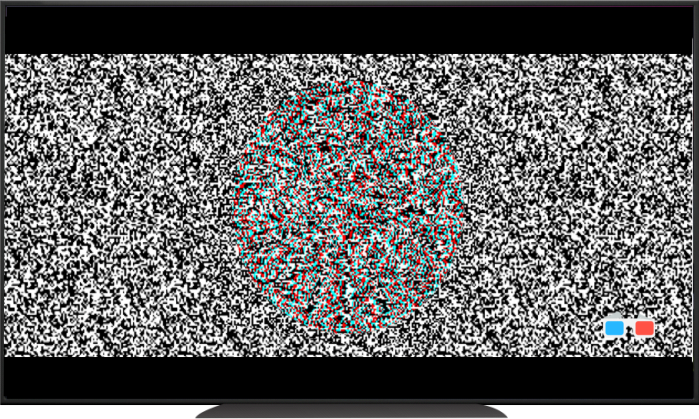
Use blue-red eyeglass to test the depth perception test. When depth perception is present, the individual will see a 3D wheel as an object jumping off the screen.
You can change to green-red eyeglasses using the arrows
Use horizontal arrows to increas/decrease size of the target
Use vertical arrows to adjust colors for better experience and calibrate to your red/green glasses
The Modified Schober Test evaluates vertical and horizontal deviations, either qualitatively (static setup) or quantitatively (dynamic setup). Here is a detailed guide based on the convention of the red filter over the right eye. When starting the Schober page, you will need to set the working distance (40 cm or 1m). It is also possible to choose the color of the filters over the left eye (blue or green).
1. Static Image with Prism Correction (Qualitative Test)
Description:
- The red cross and green circle are static.
- The patient wears red-green glasses (red filter on the right eye, green filter on the left eye).
- The patient reports to the doctor where the red cross is located relative to the green circle.
Interpretation of Results:
- The direction of the red cross displacement corresponds to the opposite movement of the right eye (with the red filter).
- Red cross shifts upward: Right eye moved downward → Right Hypophoria.
- Red cross shifts downward: Right eye moved upward → Right Hyperphoria.
- Red cross shifts left: Right eye moved inward (nasally) → Esophoria.
- Red cross shifts right: Right eye moved outward (temporally) → Exophoria.
Prism Correction:
- The prism is used to realign the perceived image:
- Right Hypophoria: Base up in the right eye.
- Right Hyperphoria: Base down in the right eye.
- Esophoria: Base out in the right eye.
- Exophoria: Base in in the right eye.
2. Dynamic Eye Chart Test (Quantitative Test)

Description:
- The test uses a dynamic setup where the patient adjusts the position of the red cross to center it inside the green circle using a remote control.
- The system measures the displacement and provides an approximate prism value.
Patient Action:
- The patient aligns the red cross (from their perspective) to the center of the green circle:
- If the red cross appears above the circle, they move it downward (indicating right hypophoria).
- If the red cross appears below the circle, they move it upward (indicating right hyperphoria).
- If the red cross appears to the left or right, they adjust accordingly for horizontal deviations.
Software Interpretation:
- Once aligned, the software calculates the deviation and suggests the appropriate prism correction:
- Right Hypophoria: Base up in the right eye.
- Right Hyperphoria: Base down in the right eye.
- Esophoria: Base out in the right eye.
- Exophoria: Base in in the right eye.